Airflow Hood vs Duct Traverse: Why TAB Readings Disagree
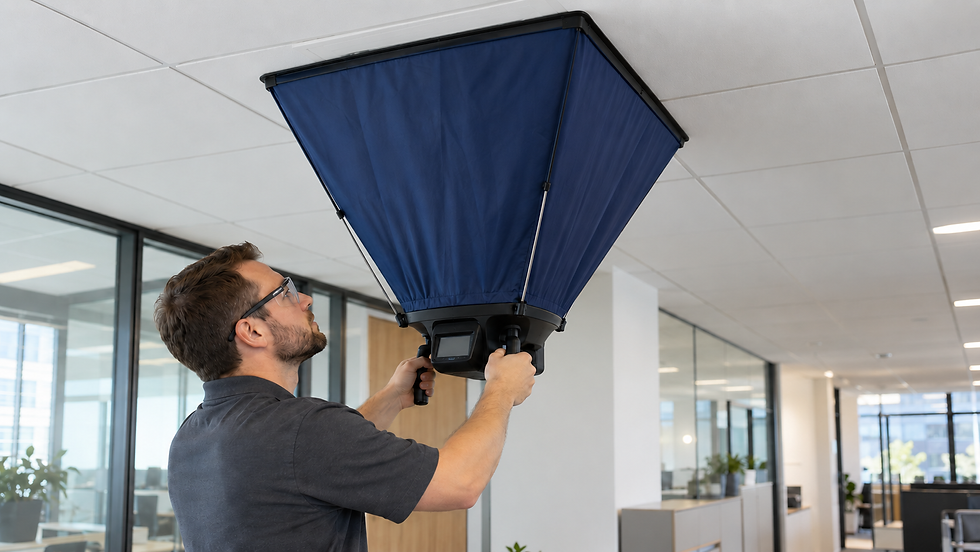
AI-generated cover image for illustration.
A duct traverse reports 600 L/s, while the sum of the downstream terminal readings is 540 L/s. Which result should the balancing team use? Neither value can be selected simply because it is closer to the design airflow. First check that both methods measured the same air stream, in a comparable operating state, on the same reporting basis.
This guide explains a practical investigation sequence for ordinary air-side testing, adjusting and balancing (TAB). Follow the project-specified test method and instrument instructions. The numerical example is illustrative, not a recommended acceptance tolerance.

Original Nexora schematic. Illustrative only; not a construction or commissioning detail.
Establish the measurement boundary
Draw a small sketch showing the traverse plane, every downstream outlet, any branch take-offs and possible leakage paths. Confirm that the terminal total includes the complete group served by the traverse.
A missing outlet, an undocumented branch or a bypass can make two valid measurements look inconsistent. An upstream traverse and selected room terminals do not define the same boundary. Include terminal IDs on the sketch so a reviewer can reconcile each reading with the actual route.
For supply systems at comparable density, a repeatable upstream value above the complete downstream total can justify investigating leakage, but the difference is not proof of leakage by itself. Measurement bias and changing controls can produce a similar pattern. Resolve those possibilities before assigning a leakage quantity.
Stabilize the operating condition
Record the fan command, actual speed, system mode, relevant VAV positions and the time of each reading. Obtain any temporary test mode through the approved controls procedure and document how normal operation will be restored.
If terminals are measured sequentially while VAV boxes modulate, their sum may combine several different system states. Repeat measurements within a stable test window or use an agreed coordinated logging method. Note disturbances such as door changes, additional systems starting or occupancy-driven control changes.
The DOE HVAC commissioning guidance emphasizes verifying operation against the original design documentation. A numerical comparison without the intended sequence and operating mode is an incomplete commissioning record.
Check what the hood does to the terminal
Check that the hood captures the opening and seats correctly. Verify its condition, orientation, airflow direction and setup against the instrument instructions.
The TSI PH730/PH731 owner's manual explains hood-induced backpressure and its compensation procedure. It also discusses flow-conditioning for swirl diffusers. Follow the instructions for the actual instrument and diffuser combination rather than applying a correction from another job.
A hood can change the airflow it is attempting to measure. Repeatable readings are useful, but repeatability alone does not establish accuracy. Keep raw readings, any applied correction factor and the evidence supporting that factor separate in the report.
Check the traverse plane and method
Inspect the measurement location relative to elbows, transitions, dampers and other disturbances. Confirm the actual internal dimensions at the test plane, including the effect of internal lining, and use the point pattern required by the selected method.
TSI application note TSI-106 describes traversing multiple points to obtain a representative average velocity. It explains that proximity to flow disturbances reduces measurement quality and warns that a centre reading with a generic multiplier is not a reliable substitute for a full traverse.
With an appropriate average velocity, the volume calculation is Q = A × v. For an illustrative internal section of 0.50 m × 0.40 m and an average velocity of 3.0 m/s, Q = 0.20 × 3.0 = 0.60 m³/s, or 600 L/s. Using external duct dimensions would change the calculated area and result.
Do not drill access holes or enter unsafe positions without the site's approved procedure. Where the installed location cannot support a defensible measurement, record the limitation and agree an alternative with the responsible TAB reviewer.
Put both results on the same basis
Check units before calculating a difference: 1 m³/s is 1,000 L/s, and 1 L/s is 3.6 m³/h. A unit mismatch can overwhelm any real engineering difference.
Check whether readings use actual or standard volume flow; the TSI manual provides both options. Record the basis and relevant temperature and pressure information. Follow the instrument's conversion procedure.
Changing air density changes the actual volume associated with the same mass flow. Align the reporting basis before interpreting a difference as leakage.
Work through the 600 versus 540 L/s example
Assume the sketch confirms four terminals and their readings are 140, 135, 130 and 135 L/s. Their total is 540 L/s. Compared with the 600 L/s traverse, the difference is 60 L/s, or 10% of the traverse value.
If the design total is 600 L/s, the terminal-sum deviation from design is (540 − 600) ÷ 600 × 100 = −10%. Label the denominator: "difference between methods" and "deviation from design" answer different questions, even though they share the same number in this example.
Now repeat the investigation in order: completeness of the boundary, stable operating state, hood setup, traverse quality and reporting basis. Retain the original results and mark each later reading with the changed condition. If the discrepancy remains material, request an agreed independent check instead of averaging two uncertain methods into a seemingly precise answer.
Decide acceptance from evidence
The project specification determines the acceptance bands and required reporting method. Instrument accuracy, field setup, repeatability and system variability all matter when interpreting a borderline result. A displayed pass/fail label cannot validate an unsuitable measurement.
Nexora's Air Balancing (TAB) Toolkit includes an Excel workbook for design and measured airflows, configurable tolerance bands, instrument calibration-status checks, deficiencies and a summary report, plus a pocket field handbook. It helps preserve the evidence; it does not replace a valid field method or approve the result.
For its reporting workflow, see the TAB Toolkit article. Close the discrepancy only when the chosen result, method, test condition and reviewer decision can be traced from the final report.

Comments