Belt-Driven AHU Fans: Separate Motor Speed, Pulley Ratio and Belt Slip
Start with two shaft speeds
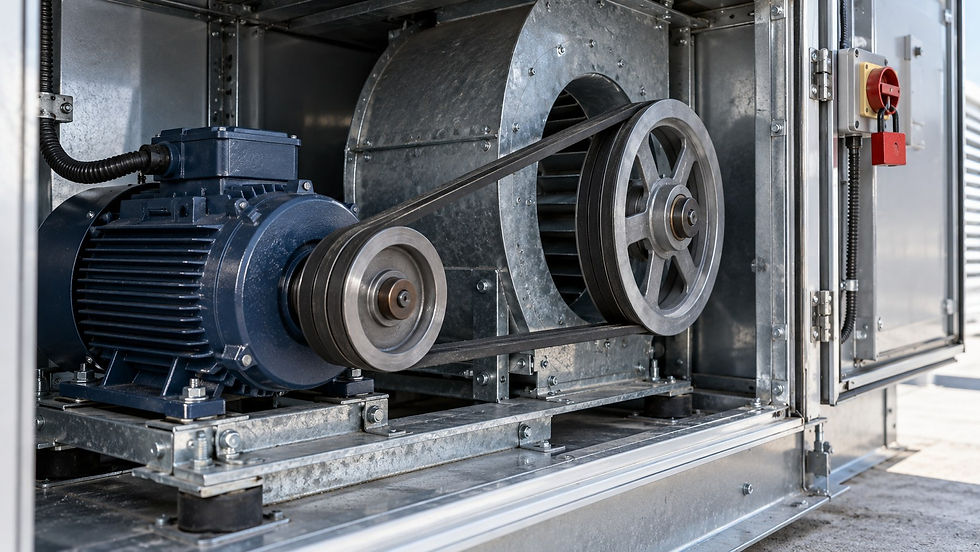
A belt-driven AHU delivers less air than scheduled. The motor is running, the drive reports the expected frequency, and the fan looks normal. Before increasing speed, measure what the drive is actually transmitting. A commissioning sheet needs the motor shaft RPM, fan shaft RPM and documented pulley geometry at the same stable operating condition.
This separates three questions: whether the motor is turning at the expected speed, whether the installed ratio matches the selection, and whether the fan is slower than that ratio predicts. Each points to a different investigation. Changing a pulley before making this distinction can conceal the original problem and introduce an overload.
Use the correct diameter and operating speed
For a friction-belt drive, the ideal speed relationship is N_fan = N_motor × D_motor / D_fan. Diameters must use the corresponding belt pitch or manufacturer-designated datum basis. An outside-rim measurement is insufficient unless converted using the correct belt and sheave data. Gates’ drive-design guidance uses pitch diameters for speed ratios and notes that induction-motor speed changes with operating conditions.
For an adjustable motor sheave, record its model, belt section and setting, then obtain the applicable effective diameter from its documentation. Do not assume that one turn produces a universal RPM change. Worn grooves and an incorrect belt section also change where the belt rides and make a nominal-diameter comparison less reliable.
Worked example: identify the apparent shortfall
Assume a four-pole induction motor operates at 50 Hz. Its synchronous speed is 120 × 50 / 4 = 1,500 RPM, while the measured motor shaft speed is 1,465 RPM. The difference, 2.33%, is motor slip relative to synchronous speed. Using 1,500 RPM in the belt calculation would wrongly assign part of that difference to the transmission.
For this illustrative test, the verified motor and fan pulley pitch diameters are 125 mm and 280 mm. The ideal fan speed is therefore 1,465 × 125 / 280 = 654.0 RPM. The fan shaft measurement is 631 RPM.
Apparent drive speed loss = 100 × (1 − 631 / 654.0) = 3.52%. Call this an apparent loss until pulley data and measurement uncertainty are checked. Belt creep, actual slipping, groove wear, diameter uncertainty and tachometer errors can all contribute. This calculation is a diagnostic comparison; it does not supply a universal acceptable-slip limit.
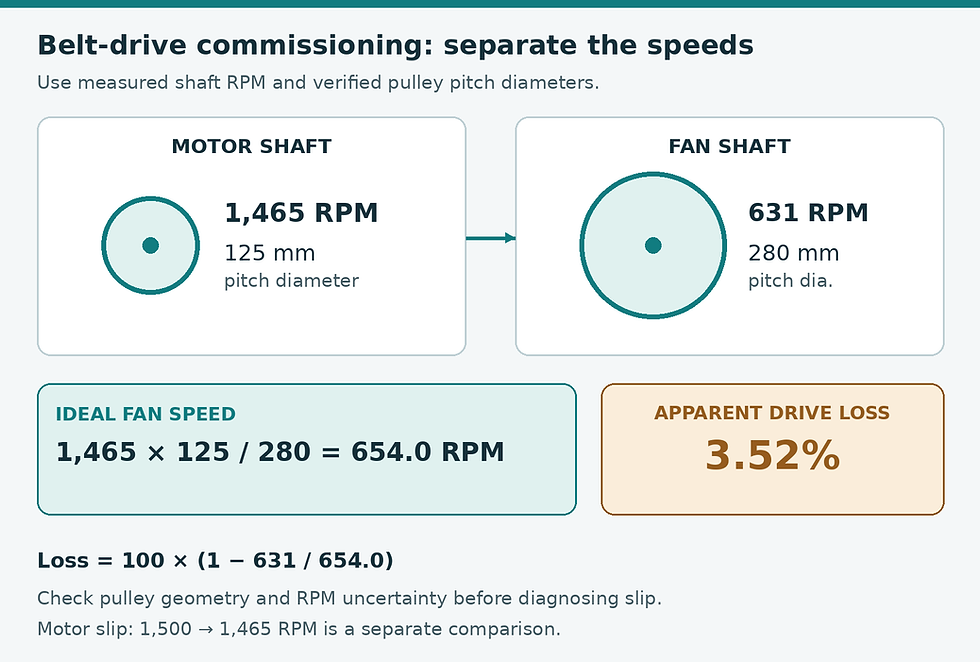
Illustrative speed comparison. Apparent drive loss is a diagnostic result, not a universal slip acceptance limit.
Check measurement quality before adjustment
Use a safe, manufacturer-approved non-contact measurement arrangement. Prepare any reflective target only while the equipment is isolated, locked out and stopped. Guards and access doors must be in their required operating positions during the test. Never reach toward a running belt or defeat an interlock to obtain a reading.
Repeat both RPM measurements after stabilization and record the range. Confirm that the tachometer is reading one target per revolution rather than multiple reflections. On variable-speed equipment, capture drive frequency and control mode with the readings. A changing static-pressure command can make two individually correct measurements an invalid pair.
As a practical reporting check, compare the speed shortfall with the instrument accuracy and uncertainty in the effective diameters. A small calculated percentage with uncertain pulley geometry warrants better measurement before a maintenance diagnosis.
Inspect the drive under isolation
Check pulley alignment, shaft parallelism, belt condition, groove wear, tension and the motor-base fixings using the equipment and belt manufacturers’ procedures. Greenheck’s VersiVent manual requires alignment checks, adjustment with the fan off and motor-current verification after an RPM change. Its specific instructions apply to that equipment; use the installed AHU manual for the actual method and limits.
Tension should be measured with the specified method and target for the belt type and installation condition. Finger pressure is a poor commissioning record. Excessive tension can damage bearings, while replacing only part of a matched set can leave uneven load sharing. Follow the belt supplier’s replacement and run-in requirements rather than inventing a generic retensioning interval.
Restoring speed also restores load
Suppose a verified repair increases fan speed from 631 to 654.0 RPM. At unchanged density and an unchanged, approximately quadratic system resistance, the speed ratio is 1.03648. The fan-law screening estimates are 3.65% more airflow, 7.43% more pressure and 11.35% more fan shaft power. Greenheck’s fan-law explanation sets out these linear, square and cube relationships.
For an original illustrative operating point of 4.00 m³/s and 6.00 kW fan shaft power, those estimates become 4.146 m³/s and 6.68 kW. They are conditional predictions, not acceptance readings. Active dampers, control changes, different filter resistance or operation outside a similar performance region can change the result. Electrical input power also includes motor and drive losses.
Close out the commissioning record
After the approved correction, repeat RPM, airflow, pressure and motor-current measurements under a documented operating condition. Confirm maximum fan speed, motor loading and vibration against the actual equipment limits. Correct shaft speed alone does not prove correct airflow: rotation, system resistance and the measurement method still matter.
Keep the before-and-after readings, pulley identifiers, belt specification, tension method and final adjustment in the handover record. That makes the next low-airflow investigation a comparison with a known baseline instead of another guess at the sheave setting.
Sources and further reading
Continue your engineering workflow
Continue with the Air Handling Unit (AHU) Selection & Fault Diagnosis Handbook for broader selection and fault-diagnosis guidance.


Comments