AHU Filter Energy: Use the Pressure-Drop History, Not Just the Clean Rating
A clean-filter pressure drop is a useful starting point, but it does not describe an entire maintenance cycle. Resistance can change as a filter loads, while airflow, operating hours and fan efficiency can also vary. An energy comparison built from the first pressure reading alone ignores most of the period that the fan must actually serve.
The useful question is how much fan input is associated with the filter's resistance over the defined operating history. The filter itself is passive; it does not consume input energy independently. Assigning a portion of fan input to that resistance is a calculation with stated assumptions, not a separate measurement of filter consumption.
1. Set a fair comparison boundary
Before comparing candidates, hold the required filtration performance, intended airflow and installation geometry constant. Record the filter-bank arrangement, operating hours, pressure-tap boundary and replacement policy. Include changes in the required filter area or housing in the comparison rather than treating them as invisible improvements.
Eurovent Recommendation 4/24 relates filter-associated energy to airflow, average pressure drop, operating time and fan efficiency. It also cautions that standardized laboratory estimates can differ from actual applications. The worked example below uses invented field-history bins; it is not a certified product rating or an implementation of Eurovent's laboratory dust-loading procedure.
2. State the input-energy equation and efficiency boundary
At a maintained volumetric airflow Q in m³/s, filter resistance Δp in Pa and assumed total input-to-air efficiency η, the allocated fan input is P = Q × Δp/(1,000 × η), in kW. The factor 1,000 converts watts to kilowatts. Multiply each interval's input by its duration in hours to obtain kWh, then add the intervals.
Here, η includes the losses between the measured input boundary and the useful air power. A bare impeller efficiency would not automatically represent that full boundary. Use a documented efficiency or an appropriate measured system relationship for the actual equipment. A constant efficiency is convenient for teaching, but should not be presented as an invariant characteristic across every fan speed and airflow.
Assume a hypothetical AHU maintains 2.00 m³/s, has total efficiency 0.60, and operates for 3,000 hours between the defined comparison endpoints. For Filter A, assume three successive 1,000-hour bins have representative time-average pressure drops of 80, 120 and 180 Pa. These are interval averages, not three isolated spot readings, and no value is a recommended replacement threshold.
3. Reproduce the cycle-energy calculation
At 80 Pa, allocated input is 2 × 80/(1,000 × 0.60) = 0.2667 kW, giving 266.7 kWh over 1,000 hours. At 120 Pa, the corresponding result is 0.4000 kW and 400.0 kWh. At 180 Pa it is 0.6000 kW and 600.0 kWh. Adding the unrounded values gives 1,266.7 kWh for the cycle.
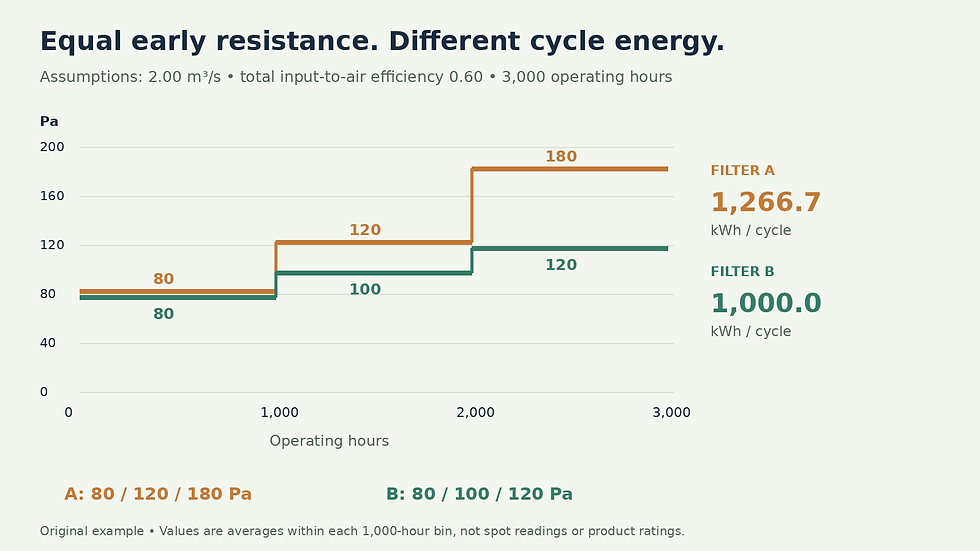
Original illustrative comparison at 2.00 m³/s, 0.60 total input-to-air efficiency and 3,000 operating hours. Values are assumptions, not product ratings.
Because the three periods are equal, average pressure drop is (80 + 120 + 180)/3 = 126.67 Pa. Substitution into 2 × 126.67 × 3,000/(1,000 × 0.60) reproduces approximately 1,266.7 kWh. Carrying extra precision until the final result prevents small apparent discrepancies between the two methods.
Now assume Filter B meets the same project filtration duty and its corresponding bin-average drops are 80, 100 and 120 Pa. Its average is 100 Pa and the same calculation gives 1,000.0 kWh. The illustrative difference is 266.7 kWh over the stated 3,000-hour cycle. Both filters had the same first-bin average of 80 Pa, so that early value alone would not reveal the difference.
Using Filter A's 80 Pa initial bin for all 3,000 hours would predict only 800 kWh. That understates the illustrated cycle by 466.7 kWh, or 36.8%. Using 180 Pa throughout would predict 1,800 kWh and overstate it by 533.3 kWh. Neither endpoint substitutes for the time history.
4. Unequal durations require unequal weights
If the 80, 120 and 180 Pa conditions instead persist for 500, 1,000 and 1,500 hours, the time-weighted pressure is (80 × 500 + 120 × 1,000 + 180 × 1,500)/3,000 = 143.33 Pa. With the same flow and efficiency, allocated input energy becomes 1,433.3 kWh. The ordinary mean of the three pressure readings remains 126.67 Pa and now gives the wrong answer.
For point samples, estimate the area under the pressure-versus-operating-time curve using a justified interpolation method. A straight-line trapezoid between readings is one possible estimate when changes are gradual. If a filter was replaced between readings, split the calculation at that event rather than drawing a gradual pressure decline that did not happen.
5. Changing airflow needs an interval calculation
When Q or η varies, calculate Q × Δp/η for each valid operating interval before summing energy. Multiplying the separate overall averages of airflow, pressure and inverse efficiency generally does not preserve the relationship between them. High resistance during low-flow hours is not equivalent to the same resistance during full-flow hours.
Fixed-speed operation introduces another limitation: as resistance changes, the fan operating point and airflow may move. A lower-resistance filter does not guarantee the same airflow or a particular input reduction. A comparison must establish equivalent delivered duty and account for the actual control response. Measuring a lower input while delivering less air cannot, by itself, demonstrate improved efficiency.
6. Build a traceable filter-cycle record
Log pressure drop with airflow, operating state and operating time. Record filter installation and replacement dates and retain the bank identification.
Use representative, simultaneous measurements. Confirm that the pressure boundary covers the filter bank being assessed rather than an adjacent coil or damper.
Record gaps, instrument limitations and changes in operating schedule. Exclude stopped-fan time from operating-hour averages or represent it explicitly with zero flow.
Compare filtration duty and physical arrangement before interpreting a lower resistance. An unintended bypass path can invalidate the comparison.
Separate energy estimates from the full maintenance decision, which also includes condition, replacement effort and the project's specified filtration requirements.
Do not derive a universal replacement pressure from this example. Its purpose is to make an energy comparison reproducible, with the assumptions visible. For broader equipment-review context, see the Air Handling Unit Selection & Fault Diagnosis Handbook. A useful final report presents the pressure history, matched operating duty, efficiency basis and estimated cycle energy together, so the next decision rests on more than a clean-filter catalog number.


Comments