Duct Pressure Class vs Fan ESP: Build the Local Pressure Envelope
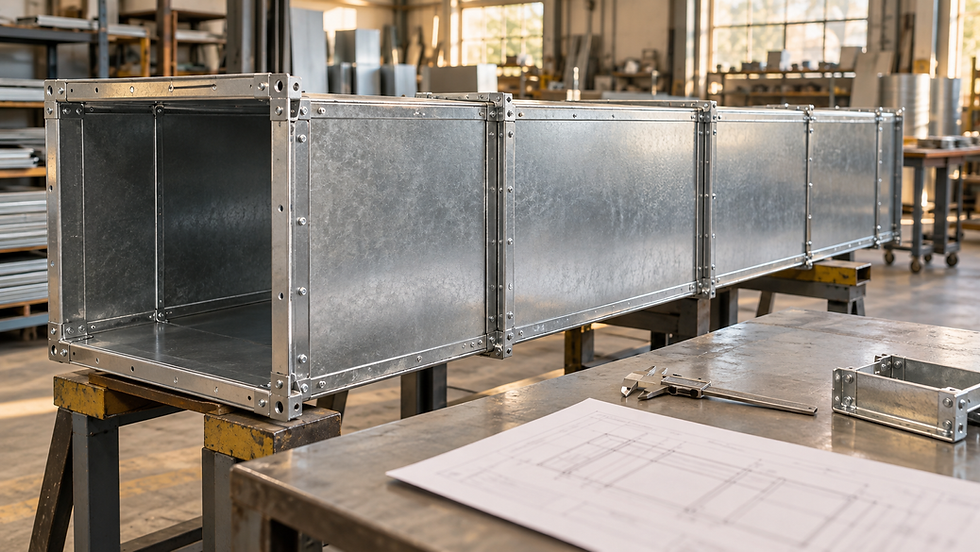
AI-generated editorial illustration; not a verified installation or construction detail.
Select construction from pressure exposure
An AHU schedule lists 1000 Pa external static pressure. Copying “1000 Pa” into every duct construction note leaves important questions unanswered: where is the duct, what is the pressure outside it, and what happens when a damper closes while the fan remains enabled?
Develop a local pressure envelope for each relevant section. Include the highest positive and most negative pressure that the design must accommodate across normal operation, transitions and credible abnormal modes. Then specify construction and component ratings that cover those conditions under the applicable project requirements.
Nexora’s duct static-pressure calculation guide addresses the airflow-resistance calculation. The construction review uses that work, plus operating scenarios, to identify pressure loads along the system.
Separate local static pressure from equipment pressure rise
Local wall loading depends primarily on the static-pressure difference across the duct wall. Fan pressure rise describes a difference between defined fan measurement stations. Equipment external static pressure describes the available or required static difference at specified equipment boundaries, with internal components treated according to the selection convention.
AMCA’s fan-curve guidance distinguishes fan static and total pressure through outlet velocity pressure. Keep these definitions on the calculation sheet. A bare-fan curve, an AHU ESP schedule and a local duct-pressure reading can all contain valid but different numbers.
ASHRAE’s Duct Construction chapter bases classification on local static loading and calls for consideration of operating modes. It also recommends considering fan shutoff pressure where shutoff can occur. Apply the adopted standard and project specification rather than assuming every jurisdiction uses the same classes.
Work through a normal AHU pressure map
Consider an original simplified example with a common surrounding-room pressure reference of 0 Pa. Assume low velocities at the four listed stations so velocity-pressure corrections are negligible. At design airflow, local static pressures are −250 Pa at the AHU return connection, −650 Pa immediately upstream of the fan assembly, +950 Pa downstream of the assembly, and +750 Pa at the supply connection.
The upstream internal loss is (−250) − (−650) = 400 Pa. The downstream internal loss is 950 − 750 = 200 Pa. The equipment external static difference is 750 − (−250) = 1000 Pa.
The pressure rise between the fan assembly’s low-velocity chambers is 950 − (−650) = 1600 Pa. It equals the 1000 Pa external difference plus 600 Pa internal loss under these assumptions. This is not a claim that every catalogue fan-static rating equals a measured static difference.
The return connection normally experiences 250 Pa suction relative to its surroundings, while the supply connection experiences 750 Pa positive pressure. The 1000 Pa ESP figure represents neither of those local loads. The AHU casing also sees different chamber pressures and needs its own verified rating.
Add two separate near-shutoff scenarios
Assume manufacturer-supported data for this hypothetical assembly establish a maximum available pressure of 2100 Pa at the highest permitted speed and relevant density, occurring near shutoff. This is an input for the example. Other fans may reach maximum pressure at nonzero flow, so examine the complete permitted curve rather than only its zero-flow endpoint.
Scenario A: a downstream isolation damper closes while the inlet remains open to the reference space and the fan is still running. As flow approaches zero, ordinary flow-related inlet and internal losses approach zero. The inlet chamber approaches 0 Pa, while the connected discharge side upstream of the closed damper can approach +2100 Pa.
Scenario B: an upstream isolation damper closes while the discharge remains open to the reference space. The discharge side approaches 0 Pa, and the suction-side volume between the closed damper and fan can approach −2100 Pa.
These are separate scenarios, not simultaneous +2100 Pa and −2100 Pa across a fan capable of 2100 Pa rise. They also show why the normal 600 Pa internal loss cannot simply be deducted from shutoff pressure: that loss was calculated at design airflow.
If the project’s applicable construction options are 1000, 1500 and 2500 Pa, a section exposed to 2100 Pa needs the 2500 Pa option for that direction, or an approved redesign that demonstrably limits its exposure. Do not silently substitute a generic percentage allowance. Final selection must include the project’s required margins and construction rules.

Original Nexora pressure map. Normal AHU ESP is 1000 Pa, while local pressures vary by station. Separate near-shutoff scenarios can expose connected duct to approximately +2100 Pa or −2100 Pa under the stated assumptions. The two extreme scenarios do not occur simultaneously; construction and component ratings must cover the applicable local envelope.
Define how far each pressure reaches
Mark the closed damper and pressure-connected volumes on each scenario drawing. A low-pressure branch downstream of a reliably closed damper is a different boundary from an upstream main that remains connected to the fan. Investigate leakage, bypass paths and alternative damper positions before crediting isolation.
Also consider maximum-speed overrides, sensor failure, fan restart, smoke-control sequences where applicable, filter-loading compensation and any return or relief fan interactions. Which cases must govern depends on the actual system and its required operating modes. Record excluded cases and the reason they are excluded.
Pressure outside the duct may differ from the room reference, especially in shafts or pressurized spaces. Evaluate the differential across the wall at that location. For example, +700 Pa inside a duct and −100 Pa outside create 800 Pa outward differential, not 700 Pa.
Treat controls as an engineered protection claim
Pressure cutouts can form part of a protection strategy. For example, Dwyer’s Series 1831 information identifies a manual-reset switch for high duct-static cutout applications. The existence of a pressure switch does not establish the complete system’s maximum pressure.
If a proposed lower construction class depends on controls, document sensor location and reference, accuracy, trip behavior, wiring, fan stopping response, pressure overshoot, reset and credible failure states. Obtain the responsible designer’s acceptance under the governing requirements. A normal BMS pressure setpoint alone is insufficient evidence of a protective limit.
Never prove a pressure envelope by deliberately deadheading an unverified installed fan or defeating protective functions. Use manufacturer data, engineering analysis and a formally approved safe functional-test method.
Check the complete assembly and connected components
Construction involves dimensions, sheet thickness, joints, reinforcement and supports. SMACNA’s technical standards overview identifies duct fabrication and installation as a complete system of requirements. A gauge-only note cannot capture the full assembly.
Check access doors, flexible connectors, dampers, terminal units and equipment connections separately for positive and negative pressure ratings. Twin City Fan’s installation guidance describes how excessive slack can pull a flexible inlet connection inward and obstruct flow. A satisfactory metal-duct class does not establish that every accessory can survive the same condition.
For an existing installation with snapping panels, Nexora’s ductwork startup-noise guide helps separate pressure-driven movement from thermal and vibration effects. Noise alone cannot quantify the construction pressure requirement.
A pressure-class review checklist
Define fan, AHU and local pressure stations, units, density and surrounding-pressure references.
Map normal pressures and identify the available pressure at every permitted fan speed.
Draw separate abnormal-mode boundaries and identify the governing positive and negative exposure.
Document every pressure-limiting protection on which the selection depends.
Schedule construction classes by section and verify connected component ratings.
Coordinate test pressures with assembly ratings and issue an approved verification procedure.
The deliverable is a pressure-class drawing supported by a scenario schedule. It should explain which condition governs each section and make later fan, control or damper changes trigger a fresh review.
Related learning resource
Nexora’s HVAC Duct Design and Sizing Handbook supports the underlying airflow, sizing, pressure-loss and fan-ESP workflow. Carry that calculation into a separate project pressure-envelope schedule before releasing construction details.
Sources and further reading
AMCA: Straightening Out Fan Curves, static and total pressure
ASHRAE Handbook 2024, Duct Construction: pressure classifications and shutoff considerations
Dwyer Series 1831 high duct-static cutout switch information
SMACNA technical standards and HVAC duct construction overview
Twin City Fan: How to Avoid Problems with Your Fan, flexible inlet connections
Engineering education only. Verify project conditions, applicable requirements and manufacturer data; use qualified professional judgment before design, selection, operation or maintenance decisions.


Comments