Fan Stroboscope Readings: A Stationary Image Does Not Prove Shaft Speed

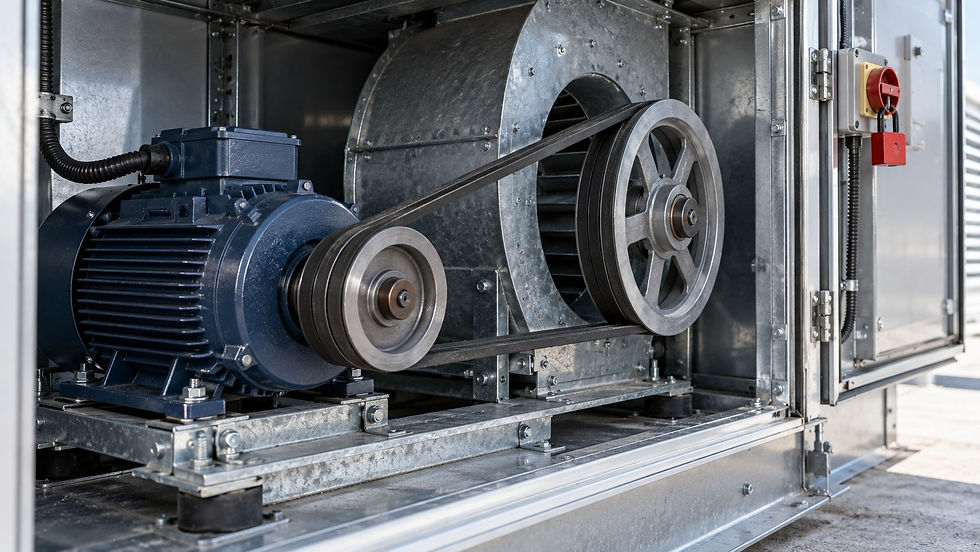
AI-generated illustrative scene, not a product screenshot or a completed-project photograph. The worked calculation below uses explicit example inputs.
A maintenance report says “fan speed 450 rpm, measured by strobe.” Before using that number in a fan-law comparison, ask what was observed. A stationary-looking image can occur when the flash rate matches a repeating pattern, including a submultiple of the actual shaft frequency. The display setting alone is not enough to establish the shaft speed.
This article explains the numerical ambiguity in an existing measurement record. It is not a field procedure for accessing rotating equipment. A stationary-looking image does not mean the machine is stopped or safe to touch. Keep guards and protective measures intact, follow the instrument instructions, and leave any measurement work to competent authorized personnel under the site's procedures.
Keep three quantities separate
Shaft frequency counts complete revolutions per second. Rotational speed in rpm is 60 times that frequency. Blade-passing frequency counts how often blade positions pass a fixed observation point and, for equally spaced blades, equals blade count multiplied by shaft frequency. A stroboscope has its own flash frequency, which is a sampling rate rather than direct proof of rotation.
Sugawara's technical guidance explains that repeated flashes can make rotation appear stationary at more than one relationship between speed and flash rate. Fluke's stroboscope guidance likewise notes integer-multiple ambiguity in stationary images. The practical consequence is simple: identify which repeating feature was observed and how the reported speed was independently confirmed.
Original six-blade example
Assume a hypothetical fan has six identical, equally spaced blades and its true shaft speed is 900 rpm. The shaft completes 15 revolutions each second. A particular blade position passes the observation point 90 times per second when all six blades are counted. These are different frequencies associated with the same machine.
Shaft frequency = 900 ÷ 60 = 15 Hz.
Blade-passing frequency = 6 × 15 = 90 Hz.
At 15 flashes/s, the rotor turns one full revolution between flashes.
At 7.5 flashes/s, it turns two full revolutions between flashes.
At 90 flashes/s, it turns one-sixth of a revolution between flashes.
A unique mark repeats its angular position at both 15 Hz and 7.5 Hz. Thus a single stationary mark at the lower rate does not prove that the shaft is turning at 450 rpm. The pattern has completed two revolutions between observations. With perfectly identical blades, the sixfold blade pattern can also repeat after one-sixth of a revolution, creating a different ambiguity at 90 Hz.
Real blades are not always identical and the visible pattern may flicker or show multiple images. That does not justify assuming a fixed correction factor from one glance. Preserve what was actually visible, the displayed flash units and the instrument mode. Treat a guessed blade count or an unclear mark as unresolved evidence rather than an RPM measurement.

Illustration of sampling ambiguity, not an instruction to approach moving machinery.
Why the wrong speed contaminates other checks
Suppose an analyst accepts the ambiguous 450 rpm display as the shaft speed and compares it with a 900 rpm design point. Under ideal fan similarity assumptions, a half-speed claim suggests half the airflow, one-quarter the pressure and one-eighth the power. Those large inferred changes arise from the speed assumption before any airflow or power evidence is considered.
The fan laws themselves do not validate the input. They also require consistent geometry and density and have application limits. In this example the actual speed has not changed at all; only the interpretation of the flash setting is wrong. A calculation should therefore retain a speed-verification gate before producing a diagnostic conclusion from a ratio.
Review the record without changing the machine
A useful evidence package identifies the fan tag, drive arrangement, observed feature, blade count if relevant, strobe model and mode, flash setting and units, and the independent speed reference. Record whether the reference is shaft-specific or simply a motor command. A VFD command is not automatically the driven fan's actual speed, particularly where a transmission sits between them.
For a belt drive, keep motor and fan shaft speeds in separate fields. If the instrument displays flashes per minute, do not label that value rpm without documenting the observation relationship. If it displays hertz, show the conversion explicitly. A screenshot of an instrument number without its measurement context is weak evidence for a performance calculation.
Close the uncertainty before issuing a diagnosis
The appropriate next step is a competent review or repeat measurement using a suitable documented method, not an unapproved speed adjustment. Do not attach marks, open guards or approach the rotor based on this article. Any physical preparation or access must follow the applicable isolation and safety procedures and the equipment manufacturer's instructions.
Once the actual shaft speed is established, compare it with independently measured airflow, pressure and power under known conditions. That separates a measurement ambiguity from a genuine operating problem. The HVAC Maintenance Checklist Pack is a related recordkeeping resource; this article does not imply that the pack certifies a rotating-machine measurement or replaces a site-specific safe work method.
Continue the calculation review
Sources and calculation basis
Primary references checked on 26 October 2026. The worked examples and diagrams are original illustrative calculations, not manufacturer selections or project approvals. Apply the stated limitations and the requirements governing the actual project.
Comments