MEP Takeoff Scale Checks: Calibrate Both Axes Before Measuring
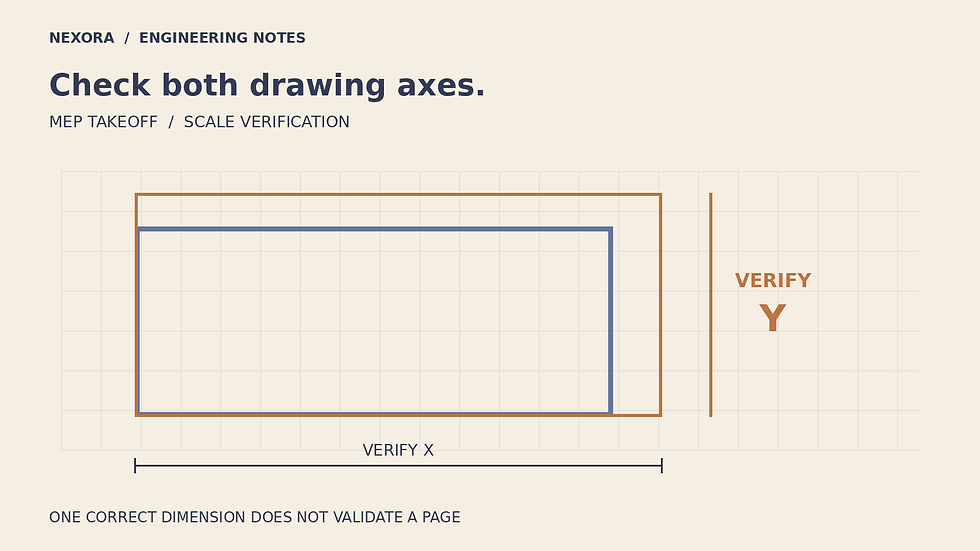
A PDF title block can say 1:100 while a digital measurement tool returns the wrong route length. The file may have been resized, exported onto another sheet size or created from a scan. An estimator who trusts the printed scale without testing the actual file can produce a consistent, detailed and systematically wrong takeoff. The problem becomes harder to spot when distortion differs between the horizontal and vertical directions.
A practical scale review answers three questions before measurement begins: which drawing region is being measured, which dimensions establish its scale, and what independent evidence confirms the result? This article uses an original geometric example to show why a single successful check is insufficient.
1. Separate sheet identity from measurement scale
Record drawing number, revision, file date and page number. Confirm that the view is intended to be measurable. A schematic, riser diagram or not-to-scale detail may communicate connections without representing physical lengths. No amount of PDF calibration turns such a view into a reliable route-length source.
The Bluebeam Revu page-scale documentation describes calibration using a known dimension, separate horizontal and vertical scales, and viewports with their own scales. These capabilities support a careful measurement workflow. They do not establish that the source dimension is correct or that a distorted scan can always be repaired with two scale factors.
Use an authoritative dimension from the issued drawing information. Pick endpoints that can be identified clearly and consistently. A long grid dimension generally offers a more useful check than a very short object whose line thickness occupies a noticeable fraction of its length. Do not substitute a guessed door width or assumed equipment size for a stated project dimension.
2. Calculate horizontal and vertical factors separately
Consider a rectangular plan region whose documented dimensions are 6.000 m horizontally and 4.000 m vertically. Under the initial PDF scale, the same spans measure 5.700 m and 3.600 m. Assume for this example that the distortion is uniform within the region, aligned with the drawing axes, and contains no shear or perspective effect.
The horizontal correction factor is 6.000/5.700 = 1.0526316. The vertical correction factor is 4.000/3.600 = 1.1111111. These factors multiply measured lengths in their respective directions. They are not interchangeable, and neither one by itself validates the page.
A horizontal route reported as 28.500 m becomes 28.500 × 1.0526316 = 30.000 m. A vertical route reported as 18.000 m becomes 18.000 × 1.1111111 = 20.000 m. Combining both corrected orthogonal route segments gives 50.000 m. Applying only the horizontal factor to their 46.500 m measured total would yield 48.947 m, still approximately 1.053 m short.
This route example assumes a path made entirely of horizontal and vertical plan segments. A diagonal segment requires its coordinate components to be transformed before its length is calculated. Multiplying every segment by whichever scale factor seems closer is not a valid general shortcut.
3. Area errors compound across axes
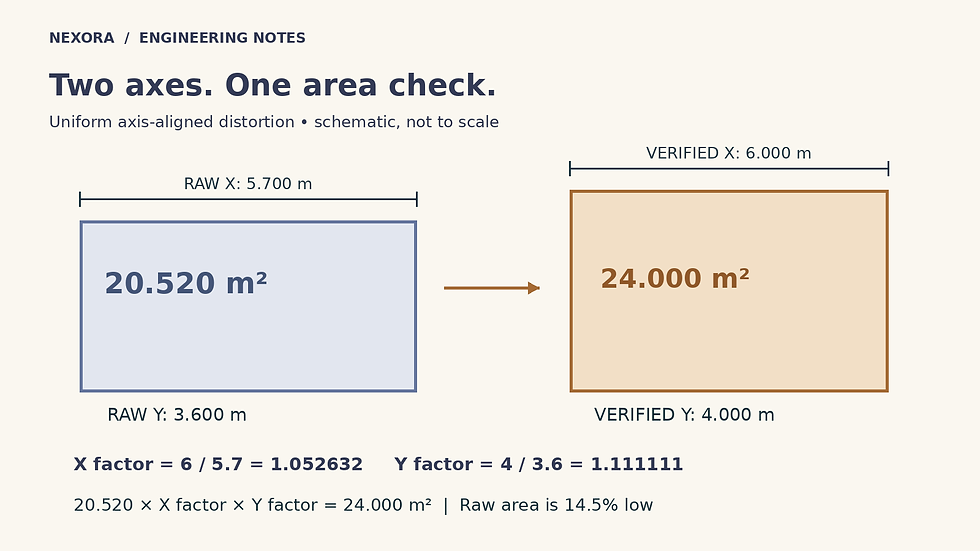
Original axis-aligned distortion example. Raw area is 14.5% low; independent dimensions are still needed after calibration.
The initial rectangle area is 5.700 × 3.600 = 20.520 m². The dimensioned area is 6.000 × 4.000 = 24.000 m². The uncorrected quantity is therefore (24.000 − 20.520)/24.000 = 14.5% below the reference. State the denominator when reporting that percentage.
For the assumed uniform, axis-aligned distortion, area scales by the product of the two factors. Thus 20.520 × 1.0526316 × 1.1111111 = 24.000 m². This multiplication follows directly from correcting the two side lengths; it is not an extra allowance to add after an area tool has already used the calibrated axes.
If the horizontal factor is incorrectly applied to both axes, the apparent area becomes 20.520 × 1.0526316² = approximately 22.737 m². The horizontal span now looks perfect, but the area remains 5.26% low. A spot check in only one direction could therefore give false confidence in an entire room-area schedule.
For a diagonal between opposite corners, the corrected length is the square root of 6.000² + 4.000², or 7.211 m. The raw diagonal is approximately 6.742 m. This offers an additional geometric cross-check, although it is not independent evidence if derived solely from the same two dimensions used for calibration.
4. Verify dimensions that did not set the scale
After setting the scales, measure a second known horizontal dimension and a second known vertical dimension in different parts of the same view. Compare each result with its stated value. A calibration can reproduce its own reference perfectly while still failing elsewhere because the page has local stretching, a skewed scan or inconsistent source geometry.
Record absolute and relative differences without assuming a universal acceptance tolerance. The acceptable discrepancy depends on the quantity purpose, drawing precision and project review requirements. Where the error is unacceptable or changes across the view, obtain a better source file or use explicitly dimensioned geometry rather than forcing a global factor to fit everything.
Photographed drawings deserve particular caution. Perspective can make parallel lines converge and change scale with position. Two independent scalar factors address only the limited distortion model assumed in this example. They do not remove arbitrary warping, skew or perspective, and a visually improved image is not automatically suitable for measurement.
5. Treat each viewport as a separate evidence boundary
One sheet can contain a floor plan, enlarged plantroom and small detail at different scales. Mark the region to which each verified calibration applies. A length that crosses between differently scaled views is not one continuous measurable route. Likewise, a revised page may have a different export history even when its title block still shows the old scale.
Keep a scale register with page, viewport, revision, reference dimensions, horizontal factor, vertical factor, independent check results and reviewer. If several pages share a verified export basis, document that evidence before reusing a scale. Similar-looking borders and matching page dimensions alone are weak proof.
Existing measurement annotations also need review after calibration changes. Do not assume historical quantities automatically update in the same way as newly drawn marks. Recheck representative old and new measurements, then regenerate or reconcile the affected quantity export. Archive the superseded takeoff so the reason for a changed total remains understandable.
6. Release quantities with their measurement basis
The final takeoff should distinguish directly dimensioned lengths, calibrated plan measurements and provisional assumptions. Add elevations or vertical offsets from appropriate views where the quantity requires three-dimensional route length. A verified plan scale still cannot reveal a concealed rise that the plan never depicts.
For broader estimating work, review the paid MEP Estimators Handbook. The transferable discipline is simple: verify both axes, validate elsewhere in the view, and retain the evidence with the quantities. Calibration is a documented measurement decision, not a one-time click at the start of a project.



Comments