Pump-Station Specific Energy: Total the kWh and Volume Before Comparing

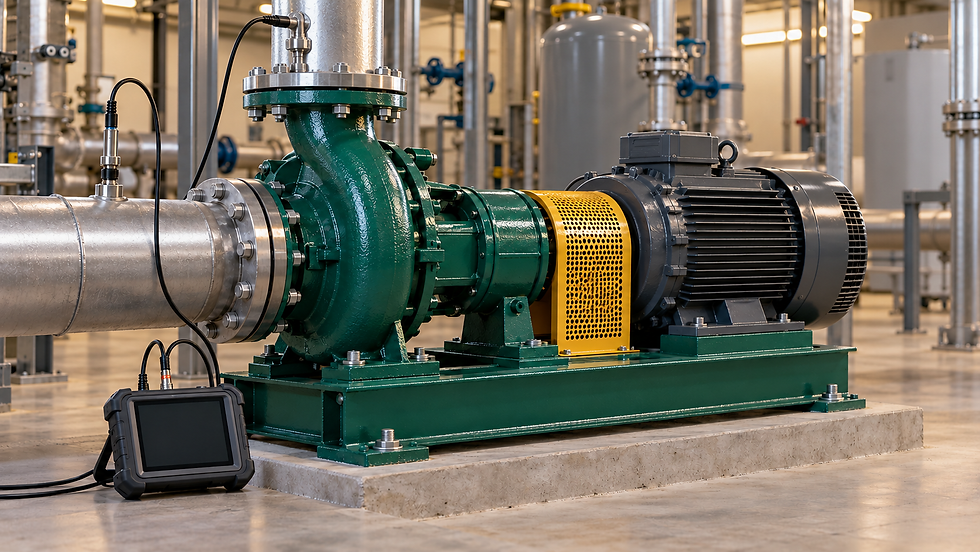
AI-generated illustrative scene, not a product screenshot or a completed-project photograph. The worked calculation below uses explicit example inputs.
A water-transfer station may have a good-looking energy ratio during one operating interval and a less attractive ratio over the full day. The difference is not necessarily a pump defect. Flow, head, operating hours, standby consumption and the measurement boundary all affect the result. Before deciding what changed, calculate the period's energy per delivered volume correctly.
Specific energy here means electrical energy divided by the volume delivered across a defined boundary, expressed in kWh/m³. It is not pump efficiency, which compares hydraulic output power with input power under a stated duty. This article uses invented operating data to demonstrate aggregation; none of the numbers represents a Nexora customer, a verified saving or an equipment guarantee.
Define what the two meters include
Choose one electrical boundary and one water boundary. An electrical meter might cover only a motor, the drive and motor together, or an entire station including controls and auxiliaries. A water meter might record gross pump discharge or the useful volume leaving the station after a recirculation branch. Both arrangements can be useful, but they answer different questions.
Write down the two meter locations and synchronize start and finish timestamps. If the energy period is midnight to midnight while the water total spans a different shift, the ratio is not date-matched. Record totalizer resets, reverse-flow handling and missing intervals before subtracting readings. Missing data is unknown, not zero consumption.
Work through three hypothetical intervals
Assume a station meter includes the operating pumps and station auxiliaries. The delivered-water meter is downstream of any internal return. During interval A, delivery is 30 m³/h for 2 hours and average electrical demand is 6 kW. During interval B, delivery is 60 m³/h for 6 hours at 9 kW. The remaining 16 hours have no delivered volume and an assumed 0.10 kW auxiliary demand.
Interval A: V_A = 30 × 2 = 60 m³; E_A = 6 × 2 = 12 kWh; E_A/V_A = 0.200 kWh/m³.
Interval B: V_B = 60 × 6 = 360 m³; E_B = 9 × 6 = 54 kWh; E_B/V_B = 0.150 kWh/m³.
Standby interval: V_C = 0 m³; E_C = 0.10 × 16 = 1.6 kWh. The interval energy-per-volume ratio is undefined because its denominator is zero.
Whole day: V_total = 420 m³; E_total = 67.6 kWh; specific energy = 67.6 / 420 = 0.16095 kWh/m³.
Do not remove the standby energy simply because its individual ratio cannot be calculated. It belongs in the station-wide total under the declared boundary. If a separate running-only indicator is useful, label it explicitly: the running intervals consume 66 kWh and deliver 420 m³, giving 0.15714 kWh/m³.

Hypothetical 24-hour station boundary; no measured saving or efficiency claim.
Why an ordinary average gives a different answer
The arithmetic mean of the two running ratios is 0.175 kWh/m³. That calculation gives the 60 m³ interval the same weight as the 360 m³ interval. It therefore does not represent energy divided by delivered volume for the combined running period.
Volume-weighted running ratio = (0.200 × 60 + 0.150 × 360) / (60 + 360) = 0.15714 kWh/m³.
Weighting these ratios by operating hours would produce another result, also different from total energy divided by total volume. The simplest robust reporting method is to sum energy and sum volume first. Retain the interval data underneath the summary so that the contribution of each operating mode remains visible.
Compare periods only after checking the duty
Suppose next week's ratio is higher. Before attributing the change to deterioration, compare delivered volume, water levels, required delivery pressure, operating modes and meter boundaries. A greater lift or different service requirement changes the work being done. A lower-volume period can also spread similar auxiliary consumption over fewer cubic metres.
The US Department of Energy's pumping-system sourcebook emphasizes representative operating conditions rather than relying on a single snapshot. Apply that principle by keeping a duty log beside the energy totals. Where a technical performance diagnosis is needed, add matched flow, head and real electrical-input measurements instead of inferring efficiency from kWh/m³ alone.
Turn the calculation into an actionable report
A useful report shows the period, data completeness, meter boundaries, delivered volume, electrical energy, calculated ratio and principal duty changes. Keep estimated intervals separate from measured totals, and identify whether auxiliaries are included. If either meter is unavailable, leave the combined indicator unverified until the missing evidence is supplied.
This reporting method helps identify which operating conditions deserve investigation. It does not itself establish a saving, justify a control change or predict revenue. The next step is a like-for-like engineering review of the largest energy contributors while preserving required service conditions and equipment limits.
Continue the calculation review
Sources and calculation basis
Primary references checked on 26 October 2026. The worked examples and diagrams are original illustrative calculations, not manufacturer selections or project approvals. Apply the stated limitations and the requirements governing the actual project.
Comments