Pump Wire-to-Water Efficiency: Reconcile Logged kW and Hydraulic Duty
Start with the measurement boundary
A chilled-water pump can consume fewer kilowatts while its wire-to-water efficiency falls. That is not automatically a fault: the pump may be serving a much smaller hydraulic duty. A useful assessment therefore keeps electrical input, hydraulic output and the required service together. Ranking operating points by efficiency alone can encourage excess pumping just to improve a percentage.
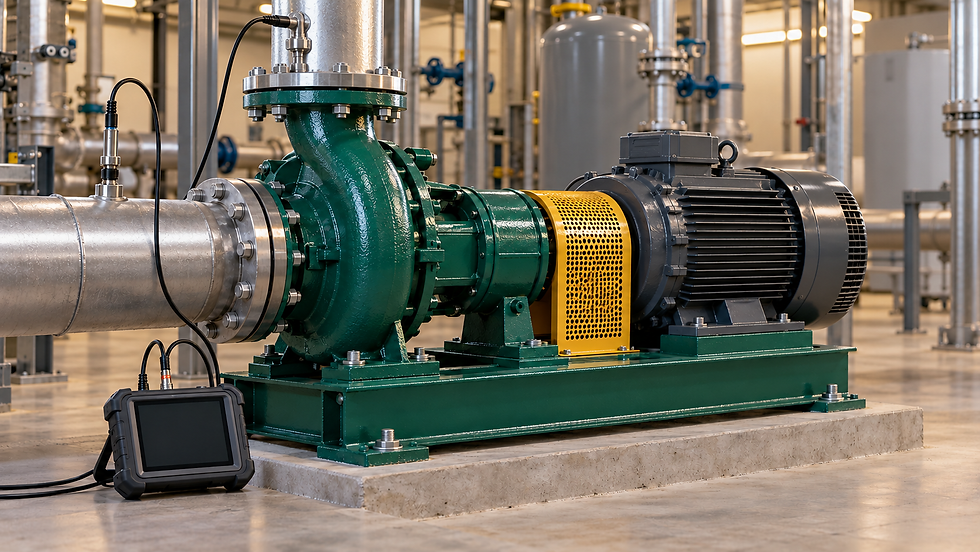
For this article, the electrical boundary is the supply to one variable-frequency drive, and the hydraulic boundary is the total-head increase between the pump suction and discharge reference sections. Drive, motor and pump losses are included. Check whether a common feeder also supplies another pump, panel heater or auxiliary device before treating its meter as a pump-only reading. DOE describes wire-to-water performance as the combined performance of the pump, motor and controls; the cited document is used for this technical definition, not a current compliance claim.
Collect synchronized measurements
Log volume flow, suction and discharge pressure, fluid temperature, measured real electrical power, pump speed and operating status on a common time base. Include the number of running pumps, bypass status and the differential-pressure setpoint. Use stable windows after staging and valve transients have settled, and retain enough raw data to identify dropouts and stale values.
Hydraulic power is Pwater = ρgQH/1,000 in kW when Q is in m³/s and H in metres. Equivalently, Pwater = Q × Δptotal when Q is in m³/s and total-pressure rise is in kPa. Correct pressure-tap readings for elevation and velocity-head differences where relevant. A remote distribution-pressure sensor generally does not measure the entire pump total head.
Use a suitably rated real-power meter and qualified personnel for electrical measurements. Do not substitute motor nameplate kW, apparent power or current alone. DOE’s motor-load fact sheet includes power factor in three-phase input power and explains why current becomes a poor load indicator at low motor loading. A drive display should be checked for whether it reports measured line input, estimated motor input or estimated shaft output.
Worked example with two operating windows
Assume clean water, negligible changes in density and two steady test windows. Corrected total-pressure rise is already available, so no separate density conversion is needed. Window A has 25.0 L/s, 180 kPa and 7.20 kW measured upstream of the drive. Hydraulic output is 0.0250 × 180 = 4.50 kW. Wire-to-water efficiency is 4.50/7.20 = 62.5%.
Window B has 15.0 L/s, 110 kPa and 3.20 kW. Hydraulic output is 0.0150 × 110 = 1.65 kW, giving 51.6% wire-to-water efficiency. Electrical demand fell 55.6%, while hydraulic output fell 63.3%. The second window uses less electricity; the conversion efficiency is lower because electrical input did not fall in proportion to the hydraulic output.
These points cannot establish a deterioration trend because their duties differ. To investigate wear or a repair, repeat comparable flow, head, speed and fluid conditions. To investigate control performance, first establish whether each window delivered the required terminal flow and pressure without unnecessary bypassing or throttling.
Compare a complete package with a complete package
A bare-pump curve showing 75% efficiency is not a direct benchmark for a measured 62.5% wire-to-water value. For an illustrative package with pump efficiency 0.75, motor efficiency 0.94 and drive efficiency 0.97 at the same duty, combined efficiency is 0.75 × 0.94 × 0.97 = 68.4%. Supplying 4.50 kW hydraulically would then require about 6.58 kW electrically.
The illustrative 6.58 kW is a calculation, not an acceptance limit for the measured pump. Obtain the selected equipment’s efficiencies at the actual operating point and agreed test tolerances. The Hydraulic Institute distinguishes pump input power from motor input and identifies duty, fluid properties and pump condition as separate reasons for unexpected power demand. Do not diagnose worn internals solely from a mismatch with a catalogue peak efficiency.
Aggregate energy instead of averaging percentages
Suppose A lasts one hour and B lasts three hours. Hydraulic energy delivered over these four hours is 4.50 × 1 + 1.65 × 3 = 9.45 kWh. Electrical energy is 7.20 × 1 + 3.20 × 3 = 16.80 kWh. Period wire-to-water efficiency is therefore 9.45/16.80 = 56.25%. The time-weighted average of the two efficiencies would be 54.30%, which answers a different question.
For interval data, sum Q × Δptotal × interval duration and divide by the corresponding electrical-energy sum. Calculate the hydraulic product from aligned samples rather than multiplying unrelated daily averages. Exclude invalid measurements with a documented rule, disclose missing coverage and distinguish standby consumption from pump-running performance. For parallel pumps, a common flowmeter supports a package calculation only when the electrical and hydraulic boundaries are consistent.
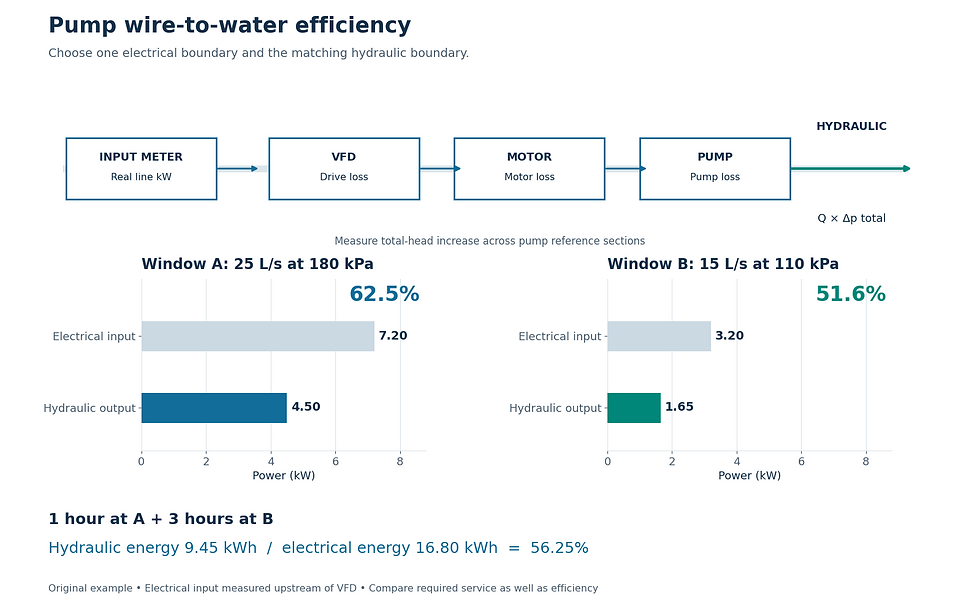
Original illustrative measurements. Lower electrical power can accompany lower wire-to-water efficiency; period efficiency uses the ratio of integrated energies.
Turn the result into a useful investigation
Estimate measurement uncertainty before setting alarms. Illustrative independent relative standard uncertainties of 2% in flow, 1% in total-pressure rise and 1% in electrical power combine to √(2² + 1² + 1²) = 2.45% relative uncertainty in efficiency, or about 1.53 percentage points at 62.5%. Correlated errors, installation bias and drift require separate assessment.
Keep a dated baseline by duty range. Investigate sustained deviations after checking meters, control overrides, flow allocation and the selected pump curve. Record required service alongside input energy, so an apparent efficiency improvement cannot conceal overpumping. The useful outcome is a repeatable evidence trail showing what duty was delivered, what electricity it required and what changed.
Sources and further reading
Continue your engineering workflow
Develop the hydraulic duty and review the power estimate with the Pump Head Calculator Design Suite, a paid, editable Excel workbook with pressure-loss calculations and a printable engineering report.


Comments