Duct Expansion Transitions: Angle, Static Recovery and Total-Pressure Loss
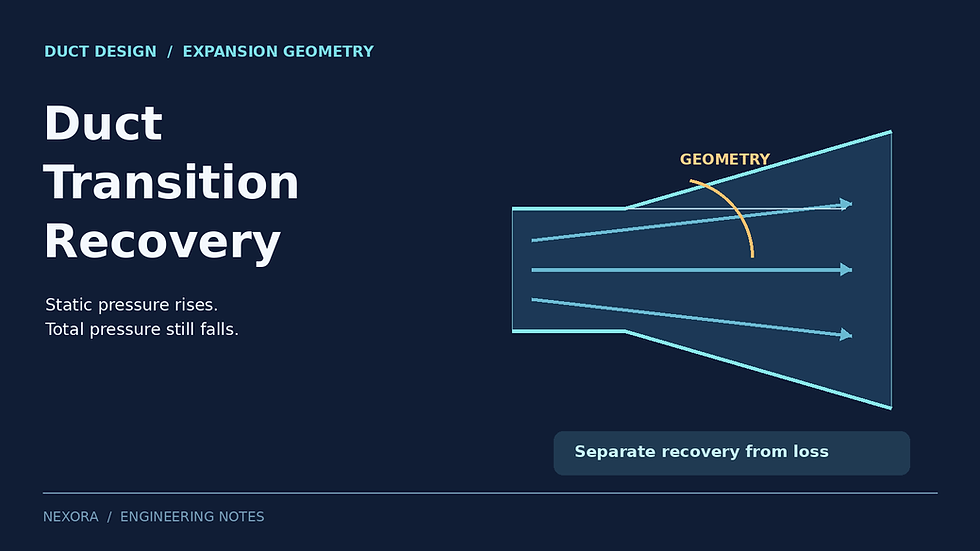
A duct expansion slows the air, allowing part of its velocity pressure to become static pressure. The same transition also dissipates energy through wall friction, mixing and possible separation. A higher downstream static reading can therefore coexist with a positive total-pressure loss. This distinction matters when a short transition is proposed to solve a coordination clash.
1. Establish the pressure bookkeeping
For low-speed air of approximately constant density, use p_t = p_s + p_v and p_v = ρV²/2. Between two representative planes without a fan, p_s2 − p_s1 = p_v1 − p_v2 − Δp_t, where Δp_t = p_t1 − p_t2 is the positive total-pressure loss. Use consistent reference pressure throughout.
ASHRAE’s Duct Design chapter explains that a diverging transition reduces velocity pressure while total pressure decreases and static pressure may rise. The change in velocity pressure is the available ideal recovery. Actual recovery is smaller when the transition dissipates energy.
These simple equations assume suitably representative average conditions. A strongly distorted velocity profile complicates the relationship between an average velocity and an energy-weighted pressure. Establish credible measurement planes before applying the calculation to a fan discharge jet or a separated flow field.
2. Work through one pressure budget
Assume an original example with 2.40 m³/s of airflow, air density 1.20 kg/m³, an inlet area of 0.300 m² and an outlet area of 0.600 m². There is no branch, leak or fan between planes. Neglect elevation change. The model treats velocity as uniform at each plane and density as constant.
Inlet velocity V1 = 2.40/0.300 = 8.00 m/s; outlet velocity V2 = 2.40/0.600 = 4.00 m/s.
Inlet velocity pressure is 1.20 × 8²/2 = 38.40 Pa. Outlet velocity pressure is 1.20 × 4²/2 = 9.60 Pa.
The ideal static-pressure rise is 38.40 − 9.60 = 28.80 Pa. This is an upper limit for the stated uniform-flow model, before losses.
Assume suitable test data give an actual static rise of 19.20 Pa. The inferred total-pressure loss is 28.80 − 19.20 = 9.60 Pa.
With an assumed inlet static pressure of 180.00 Pa, outlet static pressure is 199.20 Pa. Total pressure changes from 218.40 to 208.80 Pa. The air gains 19.20 Pa of static pressure while losing 9.60 Pa of total pressure. Nothing in this result implies that the fitting produces energy.
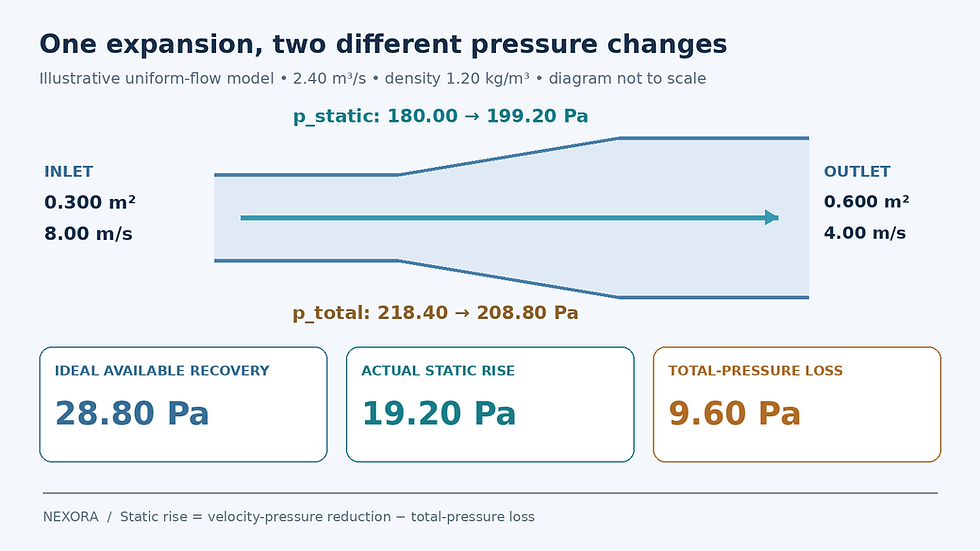
Illustrative pressure budget using uniform velocities and constant air density. The assumed static rise is not a guaranteed recovery for a specified transition angle.
Define a recovery coefficient explicitly: C_p = (p_s2 − p_s1)/p_v1. Here C_p = 0.500. The ideal value is 1 − (A1/A2)² = 0.750, and the recovery effectiveness relative to that ideal is 0.500/0.750 = 0.667. These are different quantities. The assumed measured rise is an arithmetic example, not a guaranteed value for a particular transition angle.
3. Define the angle before calculating length
Consider a centered rectangular expansion at constant height 0.500 m. Width increases from 0.600 to 1.200 m, giving the areas used above. If θ is the full included angle between the diverging sidewalls, each wall turns θ/2 from the centerline. The required axial length is L = (W2 − W1)/[2 tan(θ/2)].
At a 15° full included angle, L = 0.600/[2 tan(7.5°)] = 2.279 m.
At a 30° full included angle, L = 0.600/[2 tan(15°)] = 1.120 m.
If the drawing instead labels the angle of one wall, using it as the full included angle would give the wrong length. An eccentric transition with one straight wall needs a different geometry statement.
The shorter option saves approximately 1.16 m of axial space. The calculation has established geometry only. It has not established either option’s pressure loss. If both height and width change, document both wall-angle pairs and the area ratio; a single angle label can conceal a much more aggressive expansion in the other plane.
4. Avoid a universal “best angle” claim
Diffuser behavior depends on area ratio, length, geometry, inlet profile and boundary-layer condition. Increasing angle can encourage separation, but making a diffuser very long also adds wetted length and friction. NASA’s diffuser design discussion in its V/STOL wind-tunnel report treats pressure recovery and total-pressure loss separately and shows why optimum geometry depends on the chosen criterion and inlet condition.
Use that physics to ask better questions, rather than transplanting a wind-tunnel optimum into a building duct. Obtain applicable fitting data or manufacturer test results for the actual geometry. Confirm which velocity pressure the loss coefficient references, whether nearby fittings were included, and where inlet and outlet planes were located. If the design is unusually constrained or performance-critical, a specialist analysis may be warranted.
A transition immediately at a fan is another case that needs care. AMCA’s discussion of system effect describes the impact of unsuitable inlet and outlet conditions on installed fan performance. A standalone transition loss cannot automatically represent the entire fan-discharge arrangement.
5. Keep the fan calculation internally consistent
In a total-pressure calculation, carry the actual transition total-pressure loss as a positive loss. Account consistently for terminal and boundary velocity terms. Do not also subtract the same 19.20 Pa static recovery as a second benefit. In a static-pressure progression, calculate static change from velocity change minus total-pressure loss at each area change.
For the illustrative duty, a second candidate with only 9.60 Pa of measured static rise would have 19.20 Pa total-pressure loss. That candidate would cost an additional 9.60 Pa at the same airflow. Its incremental air power would be 2.40 × 9.60 = 23.04 W. Electrical-power impact requires the actual operating efficiency and system response, so air power alone is not an energy-savings promise.
6. Close the coordination review with evidence
Mark actual inlet and outlet dimensions, flow direction, area ratio, axial length and the angle convention.
Identify upstream elbows, dampers, fan discharge and downstream obstructions that may invalidate isolated-fitting data.
Attach the source of the selected loss or recovery value, its velocity reference and any limitations.
Show static and total pressure separately at the two planes, then update the complete critical path.
Retain access, support, acoustic and commissioning needs when selecting between geometries.
For broader duct design reference, review the paid HVAC Duct Design and Sizing Handbook. Choose the transition from its complete geometry and applicable evidence, with static recovery and total-pressure loss kept visible.


Comments