Fan Sound Power vs Room Sound Pressure: Build an Octave-Band Path
A fan submittal can satisfy airflow and pressure while providing too little information to judge room noise. An overall decibel value is not a prediction at the listener’s position. To make that prediction, identify the sound source, its transmission path and the room in which it will be heard.
The distinction matters when a project team compares a fan sound-power number directly with an occupied-room criterion. Both may be expressed in decibels, but they represent different quantities. A defensible review keeps the octave-band calculation visible from fan to receiver.
1. Keep source strength separate from the room result
Sound power level Lw describes acoustic power emitted by a source, referenced to 10⁻¹² W. Sound pressure level Lp describes acoustic pressure at a location, referenced to 20 µPa in air. These reference quantities differ; fan electrical input is neither of them. ASHRAE’s sound-and-vibration fundamentals explains their definitions and the influence of room conditions on Lp.
Request octave-band sound-power data at the selected operating duty and identify whether they describe inlet, outlet or casing radiation. Greenheck’s radiated-sound guidance distinguishes these paths and explains why assumed free-field conditions cannot simply establish a room noise rating. A catalogue sound-pressure figure needs its distance and acoustic assumptions before it is useful.
2. Draw one complete path before subtracting attenuation
For a supply-air path, start at the fan outlet, follow the actual duct route and branch, pass through the terminal, and finish at the receiving position. Keep inlet noise, casing radiation, duct breakout, ceiling transmission and structural vibration as separate paths. They may dominate a room even when the supply-air path is well treated.
At each duct element, apply appropriate frequency-dependent attenuation and account for any regenerated sound from airflow. Combine independent contributions energetically at the same boundary. ASHRAE’s noise-control chapter describes this source-path procedure and the subsequent combination of room sound-pressure contributions. Do not add an inlet spectrum to an outlet spectrum merely because both appear on the fan sheet.
3. Original example: trace seven octave bands
Assume one supply branch and one terminal at a steady operating duty. All following values are invented teaching inputs, not product data. Use the band order 63, 125, 250, 500, 1000, 2000 and 4000 Hz. Lw values are unweighted dB re 10⁻¹² W. The aggregate path attenuation includes all modeled duct, branch and terminal transmission effects up to the room-facing outlet.
Fan outlet Lw: 72, 75, 73, 70, 68, 64, 59 dB.
Aggregate path attenuation: 8, 12, 17, 21, 24, 25, 24 dB.
Residual fan Lw reaching the outlet: 64, 63, 56, 49, 44, 39, 35 dB.
Terminal-generated Lw at that same room-facing boundary: 40, 43, 45, 44, 42, 38, 33 dB.
The terminal contribution is assumed to be specified after its internal transmission effects. It is therefore not passed through the upstream duct attenuation again. At 1000 Hz, combine residual fan power at 44 dB with terminal-generated power at 42 dB: Lw,total = 10 log10(10^(44/10) + 10^(42/10)) = 46.12 dB. Subtracting 42 from 44 would have no physical meaning here. The arithmetic is explained in Nexora’s logarithmic noise-source addition guide.
Repeating that calculation gives outlet Lw totals of 64.02, 63.04, 56.33, 50.19, 46.12, 41.54 and 37.12 dB. Use full precision internally and round only for reporting. This example assumes the contributions are effectively uncorrelated broadband sound; coherent tonal interactions require a more specific analysis.
4. Apply the room correction at the receiving position
For illustration, model the outlet as a point source with directivity factor Qd = 2, receiver distance r = 3.0 m and room constant R = 80 m² at 1000 Hz. The simplified direct-plus-reverberant expression is Lp = Lw + 10 log10[Qd/(4πr²) + 4/R], using the conventional SI reference-area normalization. R is related to room surface area and absorption; it is not floor area.
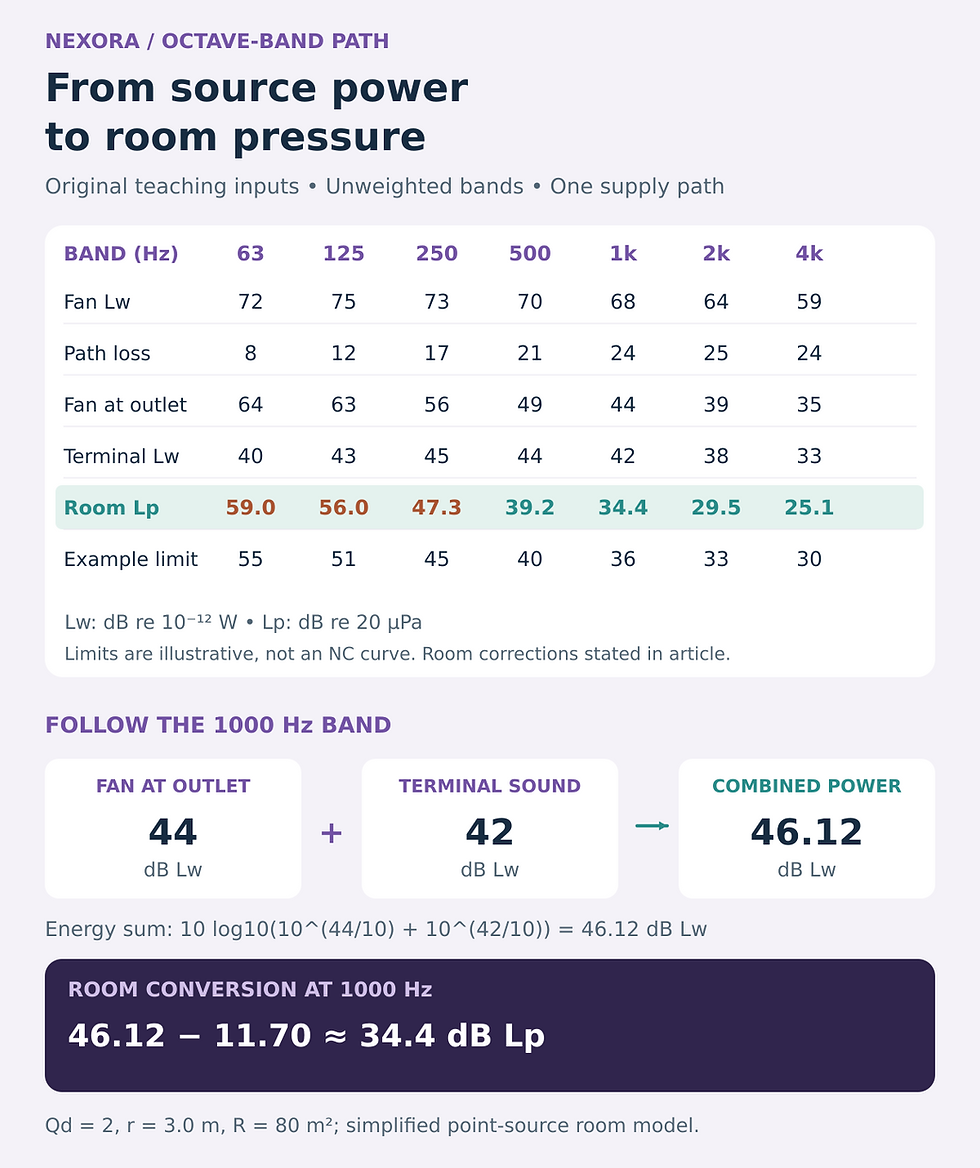
Original teaching spectrum, with invented source, attenuation and target data. The 1000 Hz room correction uses a simplified point-source model; other band corrections are stated assumptions.
The 1000 Hz correction is 10 log10[2/(4π × 3²) + 4/80] = −11.70 dB. Using unrounded values, the resulting Lp is 34.43 dB re 20 µPa. The calculation illustrates the room conversion; it does not validate a diffuse-field model for a small, irregular or strongly modal room.
To complete this teaching spectrum, assume signed room corrections of −5, −7, −9, −11, −11.70, −12 and −12 dB in the same band order. Only the 1000 Hz correction was derived above; the others are stated example inputs. The predicted room Lp values are 59.0, 56.0, 47.3, 39.2, 34.4, 29.5 and 25.1 dB. Real corrections require the room geometry, absorption, source directivity and receiver location at each frequency.
Now compare with an illustrative project ceiling of 55, 51, 45, 40, 36, 33 and 30 dB. The first three bands exceed that ceiling by about 4.0, 5.0 and 2.3 dB. This is an invented band-by-band target, not an NC rating or a universal office criterion. A single overall A-weighted number would conceal which bands need attention.
5. Check whether more upstream attenuation solves the problem
Suppose a proposed change adds 10 dB of attenuation to the fan contribution at 1000 Hz while leaving the terminal-generated sound unchanged. Fan power reaching the outlet falls from 44 to 34 dB, but the terminal still contributes 42 dB. Their new total is 10 log10(10^(34/10) + 10^(42/10)) = 42.64 dB, yielding room Lp of 30.94 dB.
The room improvement is only 34.43 − 30.94 = 3.49 dB. Once downstream generated noise dominates, additional upstream attenuation has diminishing benefit. In practice the change may also alter pressure loss and fan duty, so this isolated comparison must be followed by a revised airflow, source and regenerated-noise calculation.
6. Turn the estimate into an acceptance plan
Agree on the room criterion, relevant bands, occupied positions and operating scenarios before equipment approval. Retain source test data and every attenuation assumption. Add other relevant paths at the receiver, then examine the controlling bands rather than treating the supply-path result as the whole room.
An acoustical specialist should review sensitive spaces, strong tones, low-frequency rumble, uncertain breakout paths or small-room modal effects. Commissioning measurements should record operating duty, microphone position and background noise using suitable instruments. Neither this simplified example nor a catalogue selection establishes regulatory or contractual compliance.
For the wider duct-layout review, explore Nexora’s paid HVAC Duct Design and Sizing Handbook. Keep the acoustic path calculation alongside the pressure-loss calculation so a noise remedy does not create an unreviewed fan-duty change.


Comments