Warehouse HVLS Fans: Verify Occupied-Zone Airspeed and Coverage
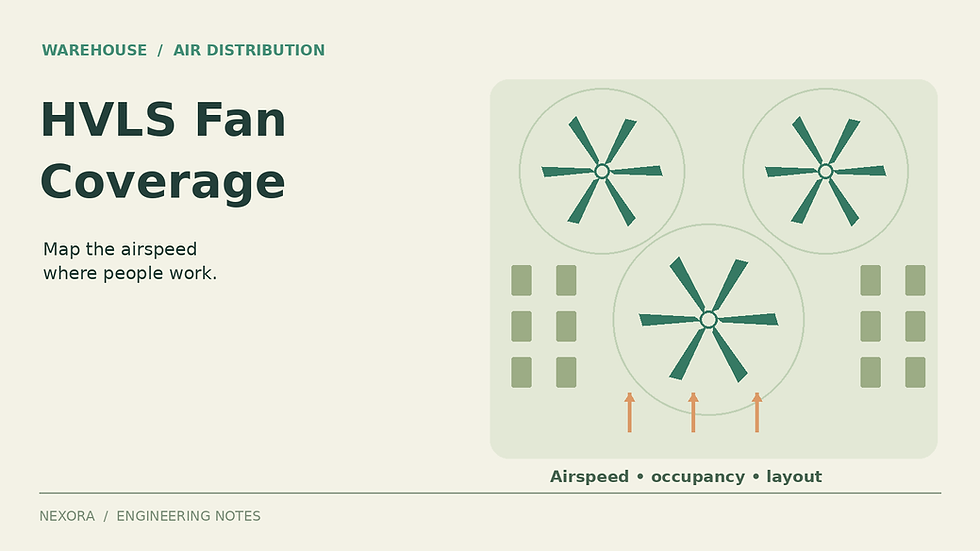
An HVLS fan proposal often arrives with a large airflow number and a circular coverage area. The decision still depends on what happens around people, racks and workstations. A fan that moves substantial air near the roof can leave a packing bench poorly served. A useful acceptance plan therefore starts with occupied-zone airspeed at defined locations, fan settings and warehouse conditions.
1. Write an airspeed brief before choosing diameter
Describe the work being done, occupied locations, clothing, operating hours and whether employees can adjust fan speed. Record dry-bulb temperature, humidity and radiant heat exposure. Air movement is one part of thermal conditions; there is no single warehouse airspeed that establishes comfort or safe working conditions for every task.
CBE’s ceiling-fan research uses spatial airspeed distributions to support fan layout. Minimum, maximum and area-weighted average values answer different questions. Its models are a useful starting point, but their tested geometry and operating limits must be checked before applying them to a high-bay warehouse filled with stock.
For the example below, assume the project team has chosen a preliminary screening band of 0.50–1.20 m/s at 1.1 m above the floor. This is an invented project criterion, not a comfort-standard limit or a heat-stress threshold. Formal assessment may need measurements at several body heights and other environmental and work-rate inputs.
2. Calculate coverage using the occupied footprint
Consider a hypothetical warehouse measuring 36 m by 24 m. Its gross floor area is 864 m². A 216 m² block used solely for inaccessible storage is excluded from this particular occupancy assessment. The remaining 648 m² is represented by eighteen equal 6 m by 6 m cells. These are measurement cells, not proposed fan-spacing cells.
Assume a survey at one stabilized operating condition gives four cells at 0.30 m/s, twelve at 0.80 m/s and two at 1.35 m/s. Each value is treated as representative of its entire cell solely to demonstrate the arithmetic. Real surveys should subdivide cells when racks, stations or measured gradients make that assumption unreasonable.
Area-weighted mean speed = (4 × 36 × 0.30 + 12 × 36 × 0.80 + 2 × 36 × 1.35)/648 = 0.75 m/s.
Area within the selected band = 12 × 36 = 432 m². Coverage = 432/648 = 66.7%.
Area below the band = 144 m², or 22.2%. Area above it = 72 m², or 11.1%.
The mean sits comfortably inside the specified band while one-third of the assessed floor area sits outside it. Reporting only 0.75 m/s would hide both conditions. If gross floor area were used as the denominator, the same passing area would yield 50%; that answers a different question and includes deliberately unassessed storage. Label the denominator on every coverage figure.
3. Check where people spend their time
Now assume each of the four low-speed cells contains one occupied station for eight hours per shift. Each acceptable cell accounts for two worker-hours per shift, and each high-speed cell accounts for two worker-hours. A worker-hour means one person occupying that cell for one hour; simultaneous occupants add their time.
Total occupancy is 4 × 8 + 12 × 2 + 2 × 2 = 60 worker-hours. Only 24 worker-hours occur inside the screening band. The occupancy-weighted in-band fraction is therefore 24/60 = 40%, substantially below the 66.7% area result.
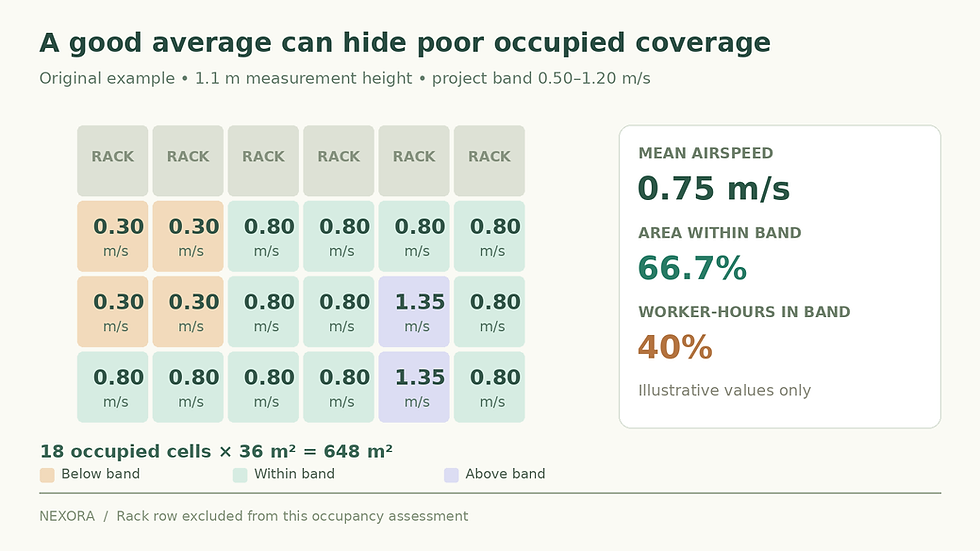
Original screening example: 66.7% of assessed area and 40% of assumed worker-hours fall within the project-selected band. Values are illustrative, not manufacturer performance.
This second metric is a prioritization aid, not a recognized compliance index. It shows why improving four packing stations may matter more than improving an intermittently used aisle. Keep both metrics: an occupancy-weighted figure could otherwise conceal a poorly served emergency work area or a location whose future occupancy will increase.
4. Change the distribution before chasing a bigger average
In this example, simply increasing every fan’s speed could improve the four weak cells while worsening the two high-speed cells. First inspect the actual airflow route: rack height, stacked pallets, mezzanines, cross-aisles and adjacent fans. Compare the proposed blade elevation with the manufacturer’s tested arrangement. Then consider repositioning, different fan sizes, separate control zones or carefully selected local air movement.
CBE’s installation guidance discusses mounting height, obstructions and multi-fan layouts. Apply it alongside the selected manufacturer’s instructions. Structural support, clearances to moving equipment, sprinkler coordination and fire-system interfaces require project-specific review by the responsible disciplines.
Ask for an updated airspeed map at the intended fan setting after each meaningful layout revision. A graphic derived from an empty test room should identify its assumptions when used to represent loaded racks. CFD can help compare alternatives when appropriately modeled and validated, but a colorful contour is not evidence that a particular workplace will achieve the advertised distribution.
5. Commission a repeatable operating condition
Mark measurement locations and heights on the plan. Include fixed stations, aisle ends, rack shadows and locations beneath the fan perimeter.
Use a calibrated low-velocity instrument suitable for changing flow direction. Record averaging duration, instrument limitations and repeat readings near acceptance boundaries.
Record fan speed, rotation direction, doors open or closed, supply and exhaust operation, stock configuration and weather. Compare like conditions when assessing a change.
Measure with fans off and on where practical. This helps identify background movement, though the difference between two speed magnitudes is not a complete airflow-vector analysis.
Repeat representative checks after stock or workstation changes. Treat a point at 0.49 m/s differently from a clearly stagnant point when instrument uncertainty spans the 0.50 m/s criterion. Establish a review band with the engineer rather than presenting rounded numbers as exact pass/fail evidence.
6. Keep circulation, ventilation and safety separate
An HVLS fan primarily circulates air already in the building. Dividing its catalog airflow by warehouse volume does not establish outdoor-air exchange or contaminant removal. Maintain separate calculations for outdoor-air supply, exhaust, moisture balance and process pollutants. A fan can redistribute contaminants as well as heat, so air movement must fit the wider ventilation design.
Where high temperatures create occupational risk, involve the competent workplace-safety team. This screening map cannot approve heat exposure, replace necessary rest or cooling measures, or establish safe conditions around hazardous processes.
For the separate outdoor-air and exhaust design work, review the paid Ventilation Exhaust Design Practical Engineering Handbook. Use an equipment-specific airspeed survey to close the HVLS coverage decision.


Comments